
x class statistics ogive curves
Ogive curves
Cumulative frequency distribution curves are also called as Ogive curves.They are Less than type ogive curve and more than type ogive curve.
The term 'ogive is pronounced as 'ojeev' and is derived from the word ogee. An ogee is a shape consisting of a concave arc flowing into a convex arc, so forming an S-shaped curve with vertical ends.
In architecture, the ogee shape is one of the characteristics of the `14^(th)`and `15^(th)`century Gothic styles.
For drawing ogives, it should be ensured that the class intervals are continuous, because cumulative frequencies are linked with boundaries, but not with limits.
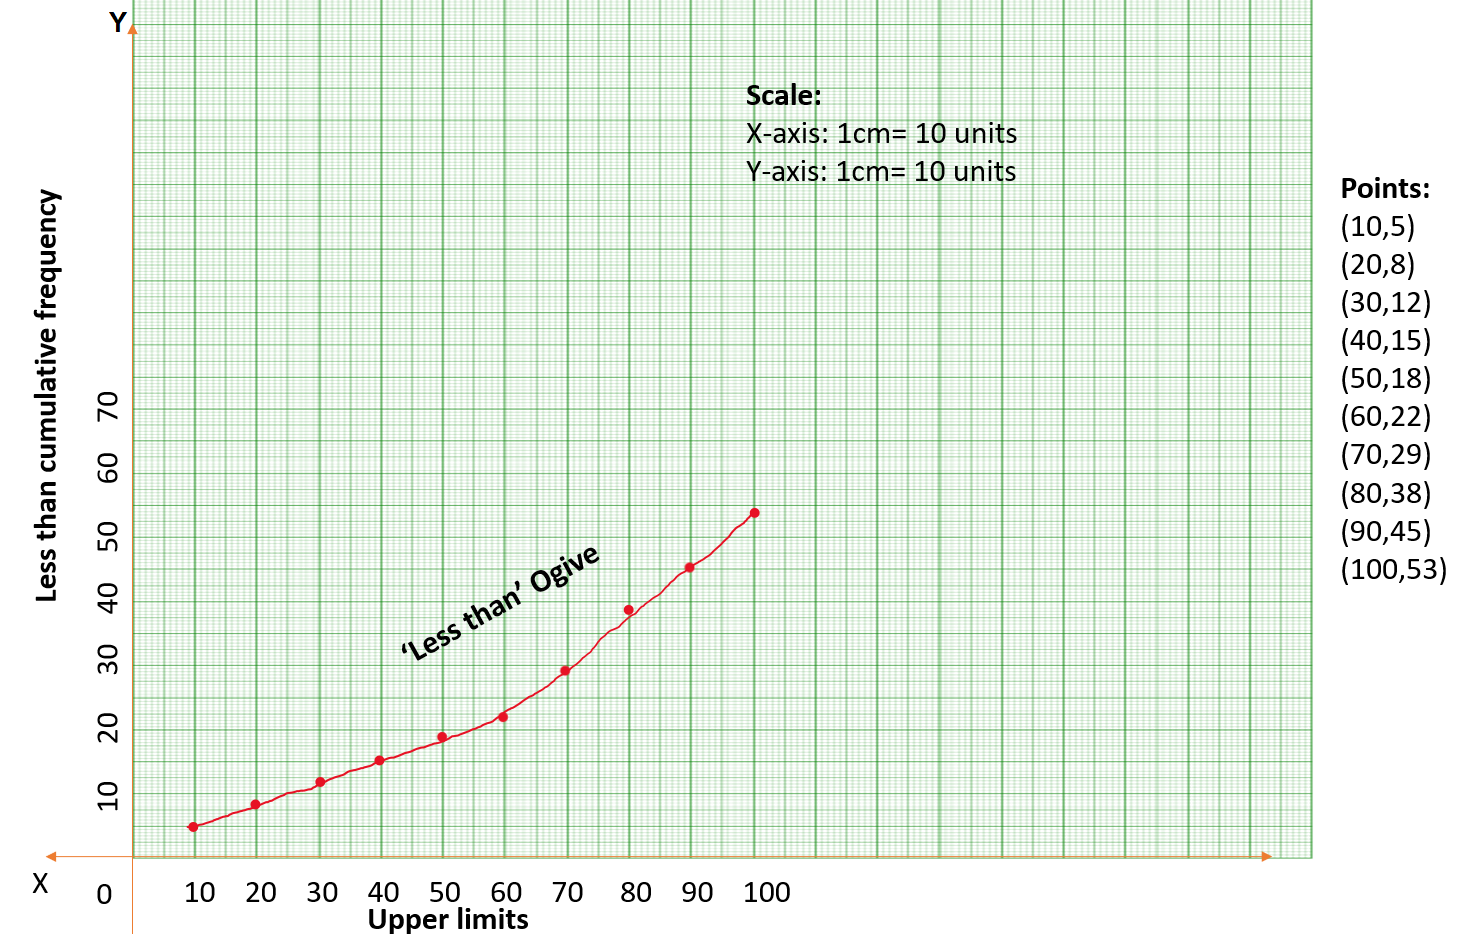
To draw Less than type ogive:
To represent 'the less than type' graphically,we mark the upper boundaries of the class intervals on the horizontal axis (X-axis) and their corresponding cumulative frequencies on the vertical axis (Y-axis), choosing a convenient scale.Then we plot the points on a graph paper, and join them by a free hand smooth curve.
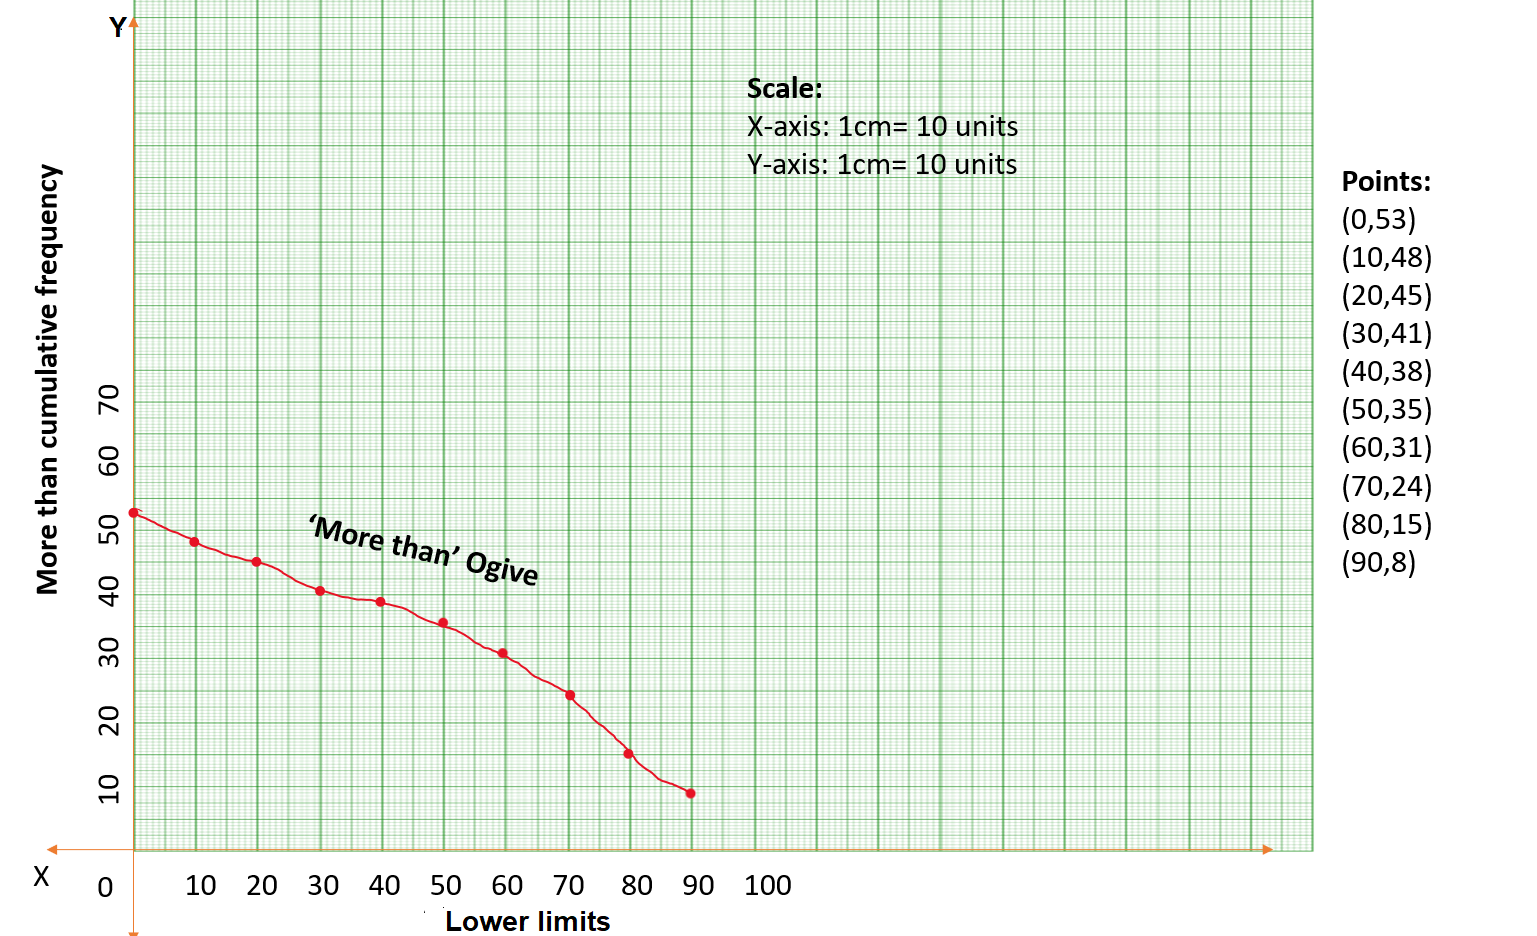
To draw More than type ogive:
To represent 'the more than type' graphically, we plot the lower boundaries on the X-axis and the corresponding cumulative frequencies on the Y-axis. choosing a convenient scale.Then we plot the points on a graph paper, and join them by a free hand smooth curve.
Obtaining Median from ogive curves
To obtain the median from these two cumulative frequency curves- locate `n/2` on the y-axis.
- From this point, draw a line parallel to the x-axis cutting the curve at a point.
- From this point, draw a perpendicular to the xaxis.
- Foot of this perpendicular determines the median of the data.
Another way of obtaining the median from the ogive curves :
Draw both ogives (i.e., of the less than type and of the more than type) on the same axis. The two ogives will intersect each other at a point. From this point, if we draw a perpendicular on the x-axis, the point at which it cuts the x-axis gives us the median.
Example:Draw both ogives for the given data.And find the median.
| Class interval | 0-10 | 10-20 | 20-30 | 30-40 | 40-50 | 50-60 | 60-70 | 70-80 | 80-90 | 90-100 |
|---|---|---|---|---|---|---|---|---|---|---|
| Frequency | 5 | 3 | 4 | 3 | 3 | 4 | 7 | 9 | 7 | 8 |
Solution:
| Class interval | Frequency | Less than cu.frequency | More than cu.frequency |
| 0-10 | 5 | 5 | 53 |
| 10-20 | 3 | 3+5=8 | 53-5=48 |
| 20-30 | 4 | 4+8=12 | 48-3=45 |
| 30-40 | 3 | 3+12=15 | 45-4=41 |
| 40-50 | 3 | 3+15=18 | 41-3=38 |
| 50-60 | 4 | 4+18=22 | 38-3=35 |
| 60-70 | 7 | 7+22=29 | 35-4=31 |
| 70-80 | 9 | 9+29=38 | 31-7=24 |
| 80-90 | 7 | 7+38=45 | 24-9=15 |
| 90-100 | 8 | 8+45=53 | 15-7=8 |
Plot the points corresponding to the ordered pairs given by (upper boundary, corresponding cumulative frequency), i.e., (10, 5), (20, 8), (30,, 12), (40, 15), (50, 18), (60, 22), (70, 29), (80, 38), (90,45), (100, 53) on a graph paper and join them by a free hand smooth curve.
More than ogive curve:
Plot the points (lower boundaries, corresponding cumulative frequency), i.e., (0, 53), (10,48), (20, (45), (30, 41), (40, 38), (50, 35), (60, 31), (70, 24), (80, 15), (90, 8), on a graph paper, and join them by a free hand smooth curve.
Median from the curves:

`therefore`Median of the data from curves is 66.4
< Exercise-3 Exercise-4 >
Post a Comment